A database’s bottleneck almost never comes from the amount of data it stores directly. It comes from the throughput it can sustain for the workload, as every request contends for the same CPU, memory, and disk resources. Modern database defaults are designed to handle this contention well for general workloads, but as load increases, the underlying resource limits will begin to dominate and performance will degrade. At that point, some may consider horizontal scaling, but in many cases, a single database node’s performance can be multiplied if it’s well understood and tuned correctly.
Working Sets, Not Data Volume
Databases store data on disk in fixed-size pages, and they cache the pages they are actively using in memory. Most of the time, a database only needs to interact with a small subset of its pages. This subset, called the working set, is what should fit into memory for the database to perform well. A database with even trillions of rows can be hosted on a lightweight computer (given enough disk space) if its working set is small enough. For example, an app might have a large user base, but the working set would only consist of pages for currently active users.
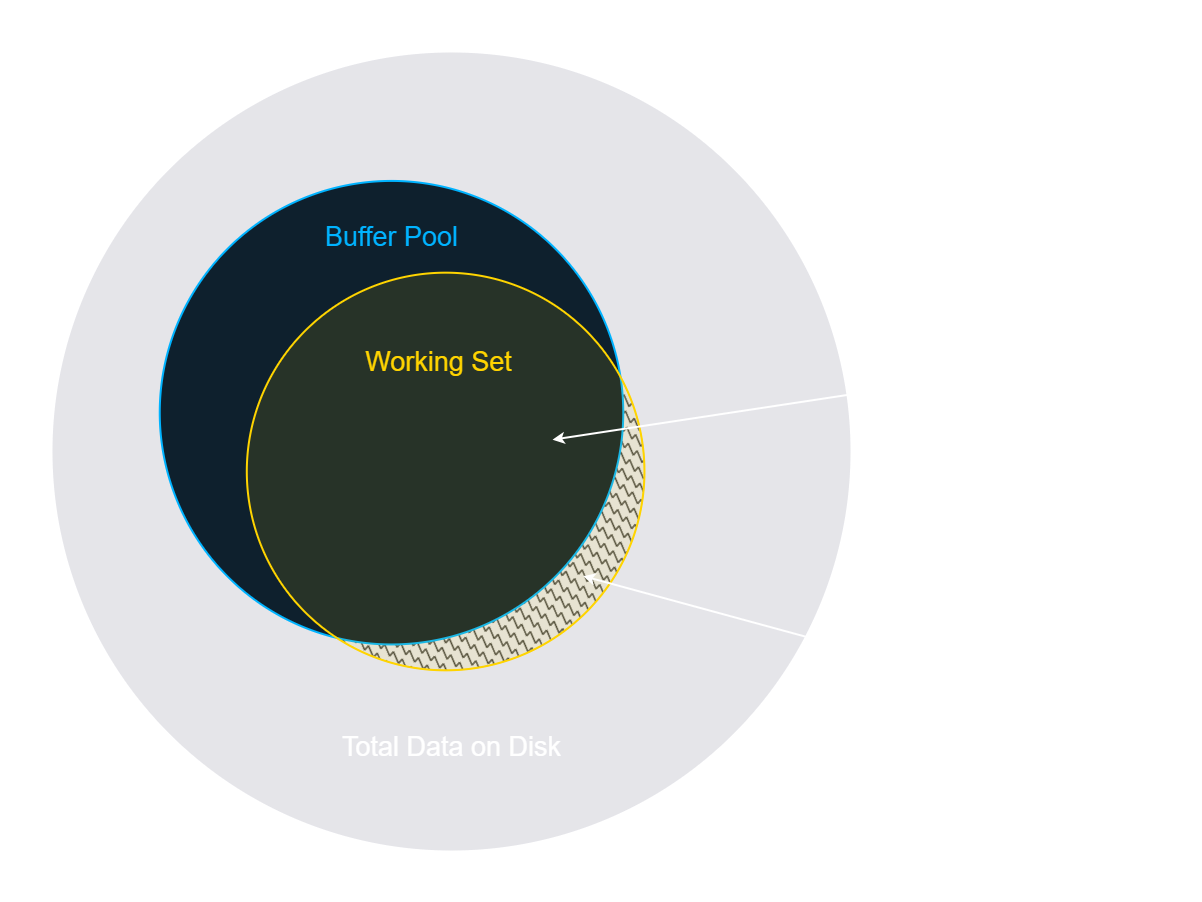
The reserved pool of memory for page caches is called the buffer pool. If the working set is even slightly larger than the buffer pool, the database will quickly become bottlenecked by disk I/O. A disk read (cache miss) takes roughly 100–1000× longer than a memory read (cache hit). So, even if 90% of the working set fits in the buffer pool, the remaining cache misses can slow down the database dramatically. This is why databases aim to keep nearly the entire working set in memory: even a small rate of cache misses will overwhelm performance.
Access Patterns
The size of the working set is primarily determined by access patterns. Hot pages that are touched repeatedly remain cached in memory, while infrequently accessed pages are evicted. So, queries that access nearby rows sequentially will be significantly faster than queries that access rows randomly. However, random access is a common pattern in real systems, like user-driven workloads where user data is stored across unrelated rows.
Most developers know to use indexes to avoid full table scans and make lookups efficient. But, it’s easy to forget that an index is itself a separate data structure stored on its own pages. A typical index lookup first walks index pages and then follows a pointer to the corresponding table page on disk. However, even if the index traversal is fast, random access patterns still cause many lookups to chase a pointer to a cold page. In that case, the lookup becomes I/O-bound, with disk latency dominating the cost of the query.
Covering indexes are designed to avoid that final disk read entirely. Modern databases let you store values from specified columns directly in the index pages. So, when a query can be satisfied using only those columns, the database avoids needing to fetch the corresponding table page. Index pages are generally denser than table pages, and each index can serve a much narrower group of queries. Because of this, index-only reads can result in much better cache locality, even under random access. This shrinks the working set, vastly outperforming regular index lookups despite having the same asymptotic time complexity.
Partial indexes apply a similar idea. Instead of indexing every row in a table, a partial index only includes rows that satisfy a specific condition. For example, an orders table might contains years of orders, but queries usually look up orders where status = ‘open’. This makes the index smaller, denser, and cheaper to keep cached in memory. When queries mostly target that subset, the database can avoid searching through irrelevant rows entirely. A separate full index would still be required to handle queries outside that subset, but having a partial index for the hot path can reduce the size of the working set.
The tradeoff is that every index has a write cost. When a row is inserted, updated, or deleted, the database has to update every affected index in addition to the table itself. More indexes can make reads faster, but they also increase write latency. So, indexes should be added for real access patterns, not just because a column might be queried eventually.
Access patterns also affect the network layer. Poorly structured transactions can unnecessarily increase the number of round trips between the application and database. Even if individual queries are efficient, issuing many small queries instead of batching them introduces unnecessary round trips, each adding latency and network overhead. Under high request volume, throughput can become bottlenecked by accumulated request latency rather than CPU or disk performance. For this reason, it’s a common design choice to co-locate application and database servers to minimize round trip time.
The Write-Ahead Log
Reads and writes both use the buffer pool, but writes have an extra requirement: durability. Before a transaction is committed, it must be flushed to disk. However, when a transaction modifies pages, the database doesn’t actually write those changes directly to the table pages on disk. Instead, it updates the pages in memory and appends to the write-ahead log (WAL).
The WAL is a sequential, append-only log that records the changes made by each transaction in the order they occur. Before a transaction is considered committed, its WAL records must be flushed to disk. This guarantees durability, as even if the database crashes before modified pages are written back to their table files, the WAL can be replayed during recovery to restore the state of the database.
Despite adding an extra write, the WAL improves throughput too. Predictable, append-only disk writes to the WAL are much faster than random writes scattered across table and index pages. Instead of forcing multiple random disk writes per transaction, the database only needs to append to the WAL and can defer writing to the actual pages until later, in batches. By batching together many updates to the same pages, this improves cache locality and reduces repeated disk I/O operations.
But even though WAL writes are faster than scattered page writes, flushing the WAL to disk is still expensive and can bottleneck write-heavy workloads. To mitigate this, databases use group commit, where multiple transactions wait briefly and then share a single WAL flush, amortizing the cost across many operations at the expense of slightly higher commit latency.
Concurrency Control
Applications typically interact with a database using a connection pool, which maintains a fixed number of connections to the database. Each connection in the pool represents an independent session inside the database that can execute one transaction at a time, although that transaction may use multiple threads internally for large or complex queries. Increasing the number of connections will enable higher throughput, but only up to a certain point. Every additional connection consumes memory, adds scheduling overhead, and increases contention as more threads compete for shared database resources.
Isolation Models
More connections enable parallel transactions, but concurrency is ultimately governed by a database’s isolation model, which defines how parallel transactions observe one another’s effects. With strong isolation, every transaction must behave as if executed one after another. This guarantees correctness at the cost of concurrency, requiring significant blocking and overhead to enforce ordering. Weaker isolation models relax serialization constraints, enabling greater concurrency by tolerating certain anomalies in exchange for reduced coordination overhead. SQL databases typically have four isolation levels:
- SERIALIZABLE: The strongest isolation level, requiring all transactions to be executed as if they ran one at a time.
- REPEATABLE READ: Transactions see a consistent snapshot of the database throughout their entire duration. Concurrent updates to rows based on the same snapshot may create logical anomalies.
- READ COMMITTED: Each statement sees the most recent snapshot. Values a transaction sees may change across statements, causing potentially inconsistent reads.
- READ UNCOMMITTED: Reads may see uncommitted changes from other transactions. Provides the weakest guarantees and is rarely supported.
To enable snapshots, databases use multiversion concurrency control (MVCC) which versions rows instead of updating them in place. When updating a row, the database creates a new version of the row while keeping older versions available for reads. Once the update is committed, subsequent transactions are directed to the new snapshot, improving concurrency at the cost of a slightly larger working set due to storing multiple versions of the same rows. To reclaim old row versions, a background vacuum process runs periodically and can be tuned to prevent table bloat under write-heavy workloads.
It’s common for high throughput systems to use READ COMMITTED, which favors concurrency over exact correctness. Stronger isolation models are used for low-tolerance systems where constraints should never be violated, such as money transfers or reservations where overbooking is unacceptable.
Write Contention & Locks
Regardless of the isolation model, no two transactions can safely modify the same row at the same time. To avoid unexpected behavior, databases use row locks to ensure that every write to the same row happens sequentially. Whenever a row is modified, the transaction acquires a lock, and other transactions trying to modify the same row are placed in a queue. Even as parallelism increases, concurrency will halt if multiple transactions are used to modify the same hot rows.
Locks are always used internally during row updates, but applications also have the ability to explicitly lock rows at read time. A common pattern is application code is read → application logic → write, where a row is first fetched, modified by the application, and then written back. In this case, if using a weak isolation model like READ COMMITTED, two transactions reading a row at the same time create a race condition. Both compute their updates based on the same snapshot, and whichever write commits last silently overwrites the other’s changes. To prevent this without increasing the isolation level, applications can use either pessimistic or optimistic locking.
Pessimistic locking assumes that conflicts are likely and locks rows at read time, forcing concurrent writers to wait before performing their own read → logic → write cycle. On the other hand, optimistic locking assumes that conflicts are rare and allows transactions to proceed without locking, only verifying at write time that the row has not changed. Rather than holding a lock during application logic, the row stores a version field that is incremented on each update, and a transaction writes only if that version remains unchanged from when it was read. Optimistic locking minimizes blocking and lock overhead and generally performs better in low-conflict workloads, but incurs expensive retry overhead when conflicts do occur.
Read Contention & Caching
MVCC allows writers to avoid blocking readers, but it does not remove all contention from read-heavy workloads. Every query must traverse shared in-memory data structures, and some reads also update page metadata so that the buffer pool can track page usage and manage which pages to evict. These operations are individually cheap, but under extreme concurrency they become a common bottleneck.
When hundreds or thousands of threads read the same small set of pages, contention shifts from row-level locks to memory-level coordination inside the database engine itself. Multiple threads repeatedly touching and modifying the same cache lines across CPU cores requires constant synchronization overhead, introducing stalls that outweigh the benefits of increased parallelism.
The most effective way to handle hot read paths is to keep them out of the database entirely. Placing a cache in front of the database allows frequently accessed data to be served from memory without needing to touch the database at all. Redis, an in-memory key-value store, is commonly used in this role. It processes requests on a single thread, which largely avoids synchronization overhead, making it especially effective at handling hot read paths.
Diagnosing the Bottleneck
The concepts discussed throughout this article are general principles. Every database has unique mechanisms and implements them differently. It’s necessary to understand which mechanisms are actually present in the system you’re using to understand where bottlenecks may emerge.
From there, diagnosis begins with monitoring and analysis. Before changing configuration or adding hardware, it’s essential to observe metrics such as CPU, memory, and disk utilization, query latency, queries per second, and buffer pool hit rates. It’s important to examine slow queries as well as application-layer tooling. Object-Relational Mappers (ORMs), which map object models to SQL queries, in particular are known to obscure inefficient query patterns. Without carefully observing the full stack, it’s easy to misattribute the bottleneck.
Horizontal scaling doesn’t remove these bottlenecks, it just spreads them across machines. Understanding and diagnosing the single-node bottleneck is a prerequisite to scaling correctly. A single well-tuned database node can often handle several times more throughput than expected, once you understand what is contending and why.